Click Here for Details
Challenging the Tongue Taste Map
©Richard Gawel
....Email this article to a friend....
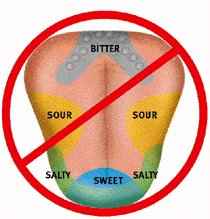
I recall attending my first lecture as a winemaking student in the subject Sensory I proudly being displayed on the OHP boldly showing areas of maximum sensitivity to the basic tastes. I found the concept of the "tongue map"
appealing in its simplicity. Everything seemed to tidily fit. There were different types of
papillae located, broadly speaking, on different areas of the tongue, and there were four
taste primaries. Surely each type of papillae contained different receptors tuned
to detect one of the four basic tastes. A corollary to this was that the tongue
must therefore contain regions that are sensitive to one of the four taste
primaries. Although this was never stated in lecture, this fact was implied, and in any
case we all left the lecture thinking that this was the case.
That map was the only diagram given in the entire lecture program that was not
sourced to published work. Why should it be? Like the Mona Lisa
everyone knew it and had seen it (many in primary school science class). Why
clutter the argument with issues such as where it came from! I recall the lecturer
stating that it arose from some work "around the turn of the century". Well
if it’s been around that long it must be correct I thought. However I did feel ill at ease when
I noticed that the tongue map was not included in important and respected sensory
works such as the classic "Principles of the Sensory Evaluation of Food"
by Amerine, Roessler and the highly respected sensory scientist Rose Marie Pangborn. Nor was
it in the then sensory blockbuster and now modern classic "Sensory Evaluation
Practices" by Stone and Sidel. But like most students I answered the inevitable question about
the tongue map that arose in the exam, stored the facts in memory and moved on.
Many years later I were to read a paper by Virginia Collings (Collings, 1974) describing
the variations across the tongue and soft palate in both
detection threshold and in the ability to discriminate between realistic taste intensities.
Collings found that there were variations in detection threshold around the perimeter of the
tongue for sweet, sour and salty but these variations were small and of no practical
significance. The bitter stimuli studied were more easily detected, not on the back of the tongue,
but on the soft palate which resides on the roof of the mouth above the back of the
tongue (yes there are taste buds there). She also reported that differences in suprathreshold
concentrations of the bitter substances studied were more easily resolved on the back
of the tongue. The suprathreshold sensitivity to the other basic tastes, like
absolute sensitivity, varied little across the other parts of the tongue.
So why the contradiction with the earlier work? Well as it turns out the contradiction was
only an apparent one. The "work from the turn of the century"turns out to be a PhD thesis
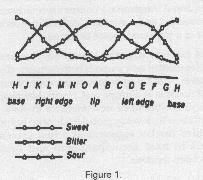
written in German by Hanig and published in Philosophische Studien in 1901. This paper
includes a diagram (Fig 5) and reproduced here in Figure 1. The y axis represents the
reciprocal of detection threshold, a measure of sensitivity. Note however that the diagram
is purely qualitative in that the y axis is scale-less. The figure was purely impressionistic.
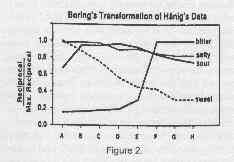
Later in 1942, Boring took Hanigs threshold data and summarised it as a percentage of
maximum sensitivity (reproduced in Figure 2). A cursory glance at both these figures would
lead you to believe that there is substantial sensitivity variation across the tongue. However
neither diagram clearly shows the actual absolute differences in threshold. In fact the
differences observed by Hanig were quite small and of no practical significance. The
interested reader can consult Bartoshuk(1993) for a more detailed account of the
origins of the taste map.
Electrophysical studies, whereby
electrical activity of taste receptors is measured in the
presence of taste stimuli, also support these interpretations.
They show that the vast majority
of taste receptors fire electrical signals, and hence elicit a
taste sensation, in the presence of
all the basic tastes. So much for receptor specificity, the
cornerstone concept underling the taste map.
As a wine and general sensory
educator I believe that this issue gets far more attention that
it
deserves. If one steps back and considers how the taste map (whether
correct or not) helps us
to assess wines, the only conclusion that can be drawn is that it
is of little practical use. Firstly,
the ability to detect tastes at threshold has been shown to be
poorly correlated with suprathreshold
sensitivity. As the majority of the compounds resulting in the
basic tastes in wines are found in
concentrations well above threshold, the practical worth of
knowing variation in detection thresholds
is questionable. Secondly, we can only apply the taste map if we
can effectively localise tastes on
the tongue. But can we do this? If you take a cotton wool bud and
soak it with a strong salt solution
and run it from the tip of your tongue, where receptors are
plentiful, to the middle where they are
very scarce, you will notice that the taste intensity does not
diminish as you might expect. As this
simple illustration of a common taste illusion is analogous to
wine moving across the tongue whilst
tasting, it is unlikely that we as humans can easily localise
tastes in realistic tasting situations.
Perhaps as wine educators we
should tell our students about things that really affect our
ability
as wine tasters. Examples are, the enormous variability between
individuals (many hundred fold) in the number
and distribution of taste receptors, which has been shown to
directly affect how strongly we perceive
tastes. Secondly individuals differ markedly in the amount and
rate of saliva they produce, and this in
turn has enormous implications for our perception of bitterness,
sweetness, saltiness, astringency and
particularly sourness. Lastly and more fundamentally, our
perception of a complex product such as
wine is determined by the interaction of tastes, aromas and
tactile sensations produced by the
various wine components. Knowledge of the nature of these
interactions is where I believe the
real focus of wine tasting education should lie.
REFERENCES
1. Bartoshuk, L. M. 1993. The
biological basis of food perception and acceptance. Food Qual.
Pref. 4:21-32
2. Boring, E. 1942. Sensation
and perception in the history of experimental psychology. New
York: Academic Press
3. Collings, V. B. 1974. Human
taste response as a function of location of stimulation on the
tongue and soft palate. Percep. Psychophys. 16:169-74
4. Hanig, D. P. 1901. Zur
psychophysik des geschmacksinnes. Philosophische Studien
17:576-623