Slick Extra Virgin

Informed and accurate information about extra virgin olive oil
  • rss
  • Home
  • About the Author

Polyphenols in Extra Virgin Olive Oil – Measurement and Effects

admin | October 12, 2015

This is the second of a short series aimed at explaining the whys, the how and the what (and the what-nots) of analyses that are commonly applied to extra virgin olive oil.

Analysis Name: Total polyphenols

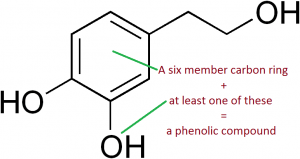
What does it measure?: The combined pool of compounds in olive oil that are in the phenolic chemical group (containing six carbon atoms attached to each other in a ring like formation with one or more oxygen+hydrogen groups attached to the ring). An example of a common olive oil polyphenol is shown in Figure 1.  In laymans terms, ‘total polyphenols’ are a measure of the combined total of the most important group of antioxidants in extra virgin olive oil.

Figure 1: Hydroxytyrosol – An example of a phenolic compound found in extra virgin olive oil.


Does the polyphenol level affect extra virgin olive oil status?: No. Many perfectly grown and made olive oils have low or medium polyphenol levels.

How it works: The polyphenols are extracted from the oil into a water/alcohol mix. A reagent is added which reacts with the polyphenols turning it blue/green. The depth of the blue/green colour is measured, and is directly proportional to the amount of polyphenols in the sample.

Is it a measure of quality?: Depends. Quality is a term that encompasses the general concept of ‘fitness for use’. So if you are ‘I want to live forever’ type of person then yes higher polyphenols which are of the antioxidant family could be perceived to be of higher quality in your eyes.  But conversely if you want to use extra virgin olive oil to make great tasting grilled potato slices on the BBQ for your hungry kids that don’t taste bitter, then a high polyphenol oil (by a consistently applied ‘fitness for use’ criterion), is of lower quality.

Analysis debuted: 1958. Initially developed for wine polyphenol analysis,  It was officially adopted in a modified (but in an incompetely described form) for olive oil by the International Olive Council in 2005.

Unit of Measurement: milligrams/kilogram of oil (1mg=1/1,000 of a gram).

Range in Extra Virgin Olive Oil: 80-2,000 mg/kg (measured as caffeic acid equivalents). Common range 200-400 mg/kg.

Accuracy of method: The first step of the analysis involves extracting the polyphenols out of the oil using a solvent. This step, depending on how carefully it is done, can cause variable end results in the order of +/- 10%. For this reason, it is necessary to repeat the test and take an average.

Use by olive oil producers: Unknown. Probably more so by New World olive producers.

Degree of difficulty: By automated lab standards the method is time and labour intensive, and therefore relatively expensive.

Practical effects of high readings of polyphenols

–  Typically more bitter and/or pungent (peppery).

–  Greater health benefits.

–  Assists in prolonging shelf life.

–  Potential for slightly higher smoke point.

Polyphenol level in extra virgin olive oil is affected by:

Cultivar – some varieties of olives tend to produce naturally higher polyphenol levels than others. For example, the average polyphenol levels in oils made from the cultivar ‘Coratina’ are significantly higher than those made from the cultivar ‘Arbequina’.

Olive maturity at harvest – The greener the olives used to make the oil, the higher the polyphenol levels.

Climate – Cool climates tend to favour higher polyphenol levels.

Tree water status – Excessive water availability reduces polyphenol levels.

Enzymes – The use of enzymes as a processing aid increases polyphenol levels

Water use during processing – Adding water to olive paste before extraction (e.g. 3 phase processing) reduces polyphenol levels.

Post harvest – Delays between harvest and processing reduce polyphenol levels.

Disease/Fruit quality – Incidence of fungal disease, olive fly attack and frost damage decreases polyphenol levels.

Age of the oil – Polyphenols levels decline as the oil ages.

Other comments:

The method only measures the size of the entire pool of the hundreds of polyphenol types that exist in extra virgin olive oil. Information about the amount of a specific polyphenol can only be achieved using highly sophisticated methods called high performance liquid chromatography or HPLC.

The relatively high cost of conducting the official method has led to an alternative rapid method to be developed. Called NIR or Near Infrared Spectroscopy, it is a method that can almost instantly estimate the polyphenol reading from a drop of oil, and it costs around 1/5 that of the official method. However it has its limitations, and its accuracy is laboratory dependent. Something for another blog post.
Post to Twitter Tweet This Post Post to Facebook Facebook

Comments
2 Comments »
Categories
Health, Production, Quality and Tasting, Use
Comments rss Comments rss
Trackback Trackback

Are Some Edible Oils Potentially More Fattening Than Others?

admin | January 6, 2015

I often get asked whether extra virgin olive oil is more fattening than other edible oils. Given the frequency that the question is posed, I’ll assume that there is some ‘information’ out there somewhere saying that it must be so. Or perhaps it is just a case of people thinking that if extra virgin olive oil is so healthy for you then it must have some downside. Can’t have your cake and eat it too right?

So I searched the peer-reviewed scientific literature to find out the energy (or calorific) values of different edible oils. Two papers provided some relevant data.

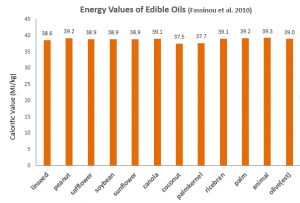
Fassinou et al. (2010) measured the energy values for a wide range of edible oils (Figure 1), but unfortunately olive oil was not one of them. However I’ve provided a logical estimate of the energy value of extra virgin olive oil based on the predictive model that they derived (1).

Figure showing the calories in different cooking oils

Figure 1: Energy values of various edible oils. Value for extra virgin olive oil is an estimate. See footnote 1.

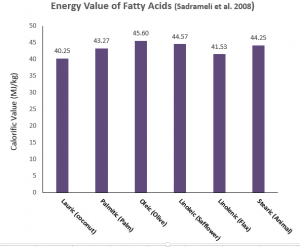
Sadrameli et al. (2008) determined the energy values of the free fatty acids themselves (actual edible oils comprise 3 fatty acids of various sorts joined together to a glycerol molecule, not as individual free fatty acids). However, these values can presumably be good proxies of the energy values of the edible oils that are rich in a particular fatty acid (oleic acid makes up on average ¾ of the fatty acids in olive oil for example) (Figure 2). However as all edible fats comprise a mixture of fatty acids combined in various combinations in groups of three, this data is at best an estimate of the energy values of real edible oils.

Figure 2: Energy values of different fatty acids. Examples of edible fats that have high proportions of that fatty acid are given in parenthesis.

So what’s the conclusion? There is no practical difference in the energy values of the different edible oils.

OK, these results do not consider that our bodies may absorb one type of fat differently from another. Some have suggested that we absorb short chain fatty acids such as those found in coconut oil differently. You can read more about the good, the bad and the ugly of this possibility elsewhere in this blog (search for coconut oil in the search box to the right), but based purely on the maximum potential of each fat to contribute to our daily energy intake, there is little evidence of any practical differences between edible oils when it comes to their energy quotient (2).

References

Fassinou, W.F., Sako, A., Fofana, A., Koua, K.B. and Toure, S. (2010) Fatty acids composition as a means to estimate the high heating value (HHV) of vegetable oils and biodiesel fuels. Energy, 35, 4949-4954. doi:10.1016/j.energy.2010.08.030

Sadrameli, S.M., Seames, W. and Mann, M. (2008) Prediction of higher heating values for saturated fatty acids from their physical properties. Fuel, 87, 1776-1780. doi:10.1016/j.fuel.2007.10.020

Footnotes:

(1) The energy value can be predicted from the ‘carbon number’ of the oil. The carbon number is the average carbon chain length of the fatty acids that comprise the oil. In olive oil the carbon number averages 17.5 (based on the fatty acid profiles of 500+ extra virgin olive oils reported by Mailer and Ayrton 2008). The energy value of the ‘typical’ extra virgin olive was then estimated using the predictive model derived by Fassinou et al. (2010)..

(2) To save you scrambling for your abacuses paleo people, coconut oil has on average 3% lower energy value compared with the other oils, which is due to the lower average carbon number of the predominant fatty acids in coconut oil. 3% less energy but 90% less antioxidants. Take your pick.

Post to Twitter Tweet This Post Post to Facebook Facebook

Comments
2 Comments »
Categories
Health
Tags
calories, coconut oil, extra virgin olive oil, fats
Comments rss Comments rss

Phenolics in extra virgin olive oil – Recent research results

admin | February 24, 2013

For once I have a theme!

But first, I must rid myself of a burden. There are no polyphenols in extra virgin olive oil. I’ve been resisting saying so for years, but now I must now confess. There is nothing poly(merised) about them. Yes, a couple of them could be a bit binary (depending on how you define it), but poly, errr no. Yes, many have a few optional extras like having attached sugars and esters hanging off them, which most certainly gives them interesting biological and health giving properties, but they are generally comprised of single simple phenolic monomers. They remind me of those troglodytes creatures that ruled the world during the Cambrian Period. There were thousands of different types – all very intricate and ecologically specialised, but in the general scheme of things, they were relatively biologically simple critters. Now I’m rid of the weight of this chemo-trivia, here are a few interesting, and practical research results about the phenolics in EVOO.

——————————————————————————————————————————

The researchers compared the ability of total phenolics and absorbance at 255nm (K255) to predict the perceived bitterness of EVOO’s. The 35 oils from 4 Italian varieties ranged in bitterness from 1 to 7 on the International Olive Council rating scale which corresponded total phenolics of around 200 to 650 mg/L, and to 0.05 to 0.65 in K255. Total phenolics were found to be a poorer predictor of perceived bitterness (correlation 0.69) compared with the almost perfect, K255 (correlation of 0.98). The bitterness of these oils could be predicted by multiplying the K255 measure by 14 and subtracting 0.6

Comment: The K255 index for bitterness was first proposed in 1992 and has been used quite widely by the international industry. Compared to total phenolics, K255 is a very easy and quick and accurate analysis. I’m not sure that the paper broke any new ground except that it provided a link between the K255 measure and bitterness ratings using the IOC rating scale. But of course the relationship given above is wholly dependent on the panel that provided the ratings. While bitterness is one the attributes on the official IOC rating sheet, to the best of my knowledge, unlike the defects, cross panel comparisons for bitterness is not conducted. Well it wasn’t done when I was a panel leader anyway. Regardless of panel differences, K255 still seems to be a good predictor of relative bitterness amongst samples.

The relatively poor relationship between bitterness and total phenolics was unexpected. I have seen other data sets where the correlation was much stronger than reported here. Interestingly, the method used to determine total phenolics was not given which was a major oversight given that the method of extraction of phenolics from the oil plays a crucial role in the outcome. The method is also notoriously subject to variable results (where a 10% error is accepted by those who do them), so doing triplicate or more replications would be needed to ensure that the poor relationship between total phenol measures and bitterness wasn’t due to measurement error.

Faviti et al. (2013) Extra virgin olive oil bitterness evaluation by sensory and chemical analyses. To appear in: Food Chemistry DOI: http://dx.doi.org/10.1016/j.foodchem.2013.01.098

——————————————————————————————————————————–

Crushing between 1 and 10% leaves with ripe olives resulted in oils with higher free fatty acidity, peroxide value and K232 (measures of primary and secondary oxidation respectively). Adding leaves produced oils with higher chlorophyll aka they were greener. Adding over 5% leaves also increased oxidative stability and tocopherol content.

Comment: Lab scale work. Phenolics were not measured which seemed to be an oversight given that both tocopherols and phenolics contribute to oxidative stability. Also personally, I’d like to think that the oil I buy is made from olive fruit rather than leaves. Call me old fashioned.

Malheiro et al. (2013) Effect of olive leaves addition during the extraction process of overmature fruits on olive oil quality. Food Bioprocessing Technology,6, 509–521.

DOI: http://dx.doi.org 10.1007/s11947-011-0719-z

——————————————————————————————————————————–

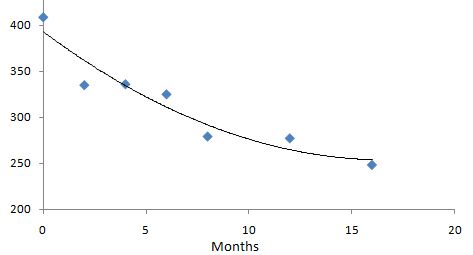
Malaxing for 40 minutes at 35C caused a 25% increase in both total phenolics and the pungent phenolic oleocanthal compared with malaxing at 25C (Figure 1), which could be explained by a 50% reduction of the activity of the major enzyme (polyphenol oxidase,  PPO) responsible for oxidative losses of phenolics at the higher temperature. The longer malaxation time, the lower the total phenolics.

Figure 1: Concentrations (mg/kg) of oleocanthal and total phenolics as a function of malaxation temperature (malaxation time = 40 minutes).

Comment: Mill scale work (yay!). The fact that high temperatures can knock out PPO probably also explains why dipping olives into hot water prior to processing results in oils with higher phenolics.

Bitchy comment: If you believe that EVOO is just a polyphenol dietary supplement (rather than a tasty food), then these results suggest that you should insist on HOT pressed olive oils.

Taticchi et al. (2013) The influence of the malaxation temperature on the activity of polyphenol-oxidase and peroxidase and on the phenolic composition of virgin olive oil. Food Chemistry, 136, 975–983.

http://dx.doi.org/10.1016/j.foodchem.2012.08.071

———————————————————————————————————————————

12 Spanish people were fed a diet that was devoid of polyphenols except for an olive oil fortified with olive oil phenolics i.e.  +250, 500 and 750mg/L. Blood plasma content of the key phenolic substances that had passed from the digestive system increased substantially when the subjects ate the oils with +500mg/L phenolics. Eating oils with +750 mg/L phenolics did not increase blood plasma phenolics over the +500mg/L diet. The authors appeared to recognise that phenolics impact on the taste and therefore the acceptability of EVOO. They stated that “The sensory acceptance is the principal barrier for the acceptance of a functional food”. In the case of EVOO high phenolics relates to high bitterness and/or pepperyness. So they also determined the taste acceptability of the oils with added phenolics. As phenolic content went up, acceptance by the tasters declined. The authors felt that the olive oil with a content of 500 mg/kg of phenolics provided “a good pharmacokinetic response and a good sensory acceptability” (in laymans terms, a good compromise between being healthy and not being overly bitter). The olive oil with 500mg/L was rated on average somewhere between “I like it a bit” and “I neither like nor dislike”. They went on to say that” Moreover, by consuming 30 ml of M-EVOO (+500mg/L) it is easy to reach the 5 mg daily dose of hydroxytyrosol and derivates recommended by the EFSA Panel”

Comment: The authors should be congratulated for recognising that long term consumption of a healthy food is only assured if it has an acceptable taste. EVOO included. But why not consume 60gms of something you really like, rather than 30 gms of something that you only like a bit?

Rubio et al. (2012) Impact of olive oil phenolic concentration on human plasmatic phenolic metabolites. Food Chemistry, 135, 2922–2929.

http://dx.doi.org/10.1016/j.foodchem.2012.07.085

Post to Twitter Tweet This Post Post to Facebook Facebook

Comments
7 Comments »
Categories
General, Health, Production, Quality and Tasting, Use
Comments rss Comments rss
Trackback Trackback

This weeks pick of Extra virgin olive oil research

admin | July 2, 2011

I try to find the time to scoure the published literature on extra virgin olive oil research each week. Mostly I find that the quality or practical relevance of the research doesn’t warrant a review but this week saw a raft of exciting stuff from a wide range of olive related fields – marketing, packaging, fraud identification and health. So here they are in a longer format and a little more commentary and explanation than usual. – RG

____________________________________________

207 Ontario consumers were asked how much extra they would hypothetically be willing to pay for extra virgin olive oil based on 1) its country of origin, 2) whether the oil was from a geographically defined area (GI), 3) whether the oil was from a Protected Designation of Origin (PDO), and a number of other factors including its organic status. Over 80% of consumers were willing to pay a significant premium ($CAN 7.68-$9.48 per litre) for oils of Italian origin over Spanish or Greek oils (which were not preferred over each other). Over ¾ of respondents preferred organic oils and said they were willing to pay around $CAN8 extra per litre for them – more than that for oils from a geographically defined area. The colour of the oil, and the colour of the glass packaging (clear vs other) did not significantly affect the amount they were willing to pay. Interestingly, while consumers were willing to pay more for GI oils, most of the premium was captured by the country of origin.  Lastly, preferences were greatly affected by shopping location. Gourmet food shoppers were willing to pay more for Italian over organic while supermarket and farmers market patrons were the opposite. The preference for Italian over other countries of origin was consistently higher regardless of shopping location.

Menapace et al. (2011) Consumers’ preferences for geographical origin labels: evidence from the Canadian olive oil market. European Review of Agricultural Economics Vol 38 (2) (2011) pp. 193–212. doi:10.1093/erae/jbq051

Comment: The authors discuss the well known phenomenon that a persons’ stated willingness to pay is usually a gross overestimation of how much they actually do pay when forking out their hard earned cash. So the $ figures stated should be taken with a grain of salt. However the results probably explain why so much extra virgin olive oil from around the Mediterranean is passed off (either explicitly or implicitly) as Italian. Those Italian looking labels and Italian sounding brand names that are actually filled with Spanish Picual have a lot to answer for.

____________________________________________

This paper reviews the use of genetic markers that remain in edible oils after processing for authentication purposes. Earlier genetic technologies required that either a large quantity of oil needed to be analysed or that the oil contained a reasonable amount of water soluble material before a sufficient quantity of DNA could be extracted. These issues seem to have been largely resolved with less than 1ml of clean oil now required. While the paper mainly focussed on the more difficult task of distinguishing varietal composition for the purposes of validating PDO status (relevant to about 1 millionth of the total value of the EVOO sector worldwide), it touched on the fact that many genetic markers specific to both olives and other seed crops used to adulterate olive oil have been determined, and these could be used to authenticate extra virgin olive oil.

Agrimonti et al. (2011) The use of food genomics to ensure the traceability of olive oil. Trends in Food Science & Technology,  237-244. doi:10.1016/j.tifs.2011.02.002

Comment: Remember when law enforcement used fairly subjective forms of evidence to prove guilt. Then along came DNA testing. Everything changed. The raft of expensive chemical tests with arbitrary limits currently used to identify adulteration could be made redundant overnight by a good genomic test. It would put an end to arguments about whether a 4% level of campesterol is too high or too low depending on what part of the world you come from or what varieties you grow. If the oil contains genetic material from a plant other than olive then end of story. Convicted as charged!! Testing is about clarity, and ensuring those that adulterate get caught, and (equally importantly) those who’s legitimately made olive oils fall outside some arbitrary limit aren’t forced to label them as worthless fruit oil.

____________________________________________

One volume on Nitrogen gas was pumped through extra virgin olive immediately after decanting and just prior to bottling. This sparging decreased dissolved oxygen in the bottled oil by 55% which resulted in a 1.6meq/kg reduction in peroxide value. Sparged oils contained 10% fewer total flavour volatiles (as expected), but actual sensory differences were not observed.

Masella et al. (2010) Nitrogen stripping to remove dissolved oxygen from extra virgin olive oil. Eur. J. Lipid Sci. Technol. 112, 1389-1392. Doi: 10.1002/ejlt.200900277

Comment: Many EVOO producers believe that their job is done once the oil is sitting in tank. Winemakers have long known that their wine is only as good as how carefully it was bottled (particularly with regard to dissolved oxygen and headspace oxygen), and the stopper that holds it. Lots more work needs to be done on bottling conditions for EVOO so as to extend the period of freshness following bottling. High polyphenols/antioxidants in EVOO are not a universal panacea for long shelf life. I’ve seen lots of high polyphenol oils that are simultaneously bitter/peppery and horribly rancid. One can only assume that they have been let down by either poor storage conditions, by having high dissolved/total oxygen at bottling, or by packaging that has a high oxygen transfer rate. We all know the appropriate conditions for EVOO storage, but the latter two influences on EVOO shelf life are largely unexplored. This paper is a good start, but optimal sparging conditions for EVOO are yet to be determined.

____________________________________________

Firstly some background to the next paper. It is widely believed that the polyphenols in extra virgin olive oil play a major role in its healthfulness. However, a number of studies have found that many of the complex, uniquely EVOO polyphenols are either broken down during digestion into smaller rather unexciting phenolics (that you find in hundreds of everyday foods and beverages), or they do not seem to be absorbed at all.  This cracker of a paper takes a close look at this and comes up with some surprising results.

The two most abundant phenolics in EVOO were shown to be resistant to breakdown by stomach acids but were chemically altered to a significant extent after they passed through a segment of intestinal wall. Specifically, the original phenolics were enzymatically reduced (the opposite of oxidised), which allowed them to be subsequently bonded to a specific type of sugar called a glucuronide.

Pinto et al. (2011) Absorption and metabolism of olive oil secoiridoids in the small intestine. British Journal of Nutrition. 105, 1607-1618. Doi: 10.1017/S000711451000526X

Comment: So what does this mean? Well to date, researchers have used specific phenolics in either blood plasma or in urine as markers of the ability of humans to absorb EVOO polyphenols. From this work it appears that they may have been looking for the wrong ones! Most analytical methods are highly specific in their scope, so if you are looking for the wrong thing, then you are most likely not to find anything. In the words of the authors “it seems reasonable that previous human studies aimed at investigating the pharmacokinetics of olive oil secoiridoids (aka polyhenols) may have underestimated the full extent of the absorption” (p 1616).

Post to Twitter Tweet This Post Post to Facebook Facebook

Comments
1 Comment »
Categories
Health, Production, Quality and Tasting
Comments rss Comments rss
Trackback Trackback

Health benefits of extra virgin olive oil – Keeping it real

admin | June 4, 2011

There have been many claims made as to the health benefits of extra virgin olive oil – While a few are well reasoned, many are over the top. Statements like “this study proves that EVOO consumption cures this cancer or that cancer” aren’t uncommon. However, these Chuck Norris type claims are usually based on a single study involving cell lines propogated in test tubes and then subjected to various olive oil components of unknown bioavailabity at hundreds or thousands of times the concentrations naturally found in EVOO. Clearly, while these in vitro studies provide a good starting point for further research ‘in the field’, they, by themselves are too far removed from reality to justify the definitive claims that often follow their publication.

I was recently asked to review the myriad of health literature on extra virgin olive oil and put my naturally scientifically trained conservative part of my brain to derive a reasoned health statement regarding the benefits of extra virgin olive oil. Here’ what I came up with:

Extra Virgin olive oil is distinguished from all other oils in that it is richly endowed with a unique combination of monounsaturated fats, polyphenols and phytosterols.

A consistent body of scientific evidence exists that diets rich in these three natural components are associated with:

–  lower levels of “bad cholesterol” (LDL) and higher levels of “good cholesterol” (HDL).

–  lower levels of heart-unfriendly oxidised LDL’s.

–  reduced DNA oxidative damage which in turn is related to a reduced risk of some cancers.

–  reduced incidence of hypertension.

–  improved glycemic control, which is particularly advantageous to diabetic patients.

Agreed, the wording is measured, which may not suit everyones marketing style when it comes to explaining the health benefits of their EVOO. But hopefully this may give some direction on how to reasonably spruik the benefits of eating extra virgin olive oil.

Richard G.

Post to Twitter Tweet This Post Post to Facebook Facebook

Comments
Comments Off on Health benefits of extra virgin olive oil – Keeping it real
Categories
Health
Comments rss Comments rss
Trackback Trackback

Polyphenol levels in EVOO: To Label or Not to Label

admin | May 29, 2011

Around 7 years ago I was reacquainted with a small olive oil producer from Western Australia. It was a chance meeting – I was staying at a hotel attending a wine conference and he was on holidays with his family. After some chat, Colin went down to his car and generously gifted me a bottle of his new season olive oil.

I forensically began to scan the labels for the nitty gritties (as I do!). Variety Pendolino – check, oleic acid level in the high 70’s-good, nope, no free fatty acid level (why tfn I thought?). But much to my surprise, hand written on the back label was the amount of polyphenols the oil – around 550 mg per kilogram if I recall correctly. Now that’s a fair slab of polyphenols which was no doubt why he put it on the label.

Polyphenols are naturally occurring antioxidants. They are found in extra virgin olive oil in the range of about 100 to 1000 mg/kg (0.1 to 1 gram per litre) with an average of around 250-300 mg/kg (when measured in caffeic acid equivalents – more on this later). No other edible fat contains significant levels of polyphenols (virgin coconut oil is the clo