Slick Extra Virgin

Informed and accurate information about extra virgin olive oil
  • rss
  • Home
  • About the Author

Measuring Oxidation in Extra Virgin Olive Oil

admin | January 21, 2016

This is the 3rd of a short series aimed at explaining the whys, the how and the what (and the what-nots) of analyses that are commonly applied to extra virgin olive oil. This time, I present what I think is a reliable indicator of olive oil oxidation – K232.

FACT FILE

Name: K232 (short for absorbance at 232 nanometers).

What does it measure?: Level of oxidation.

How does it work? All olive oils contain some polyunsaturated fatty acids. These have a basic chemical structure that has two chemical double bonds amongst a long line of single chemical bonds. In an unoxidised state, the pattern of bonding is (Double-Single-Single-Double). But during oxidation of the fatty acid, the conga line of bonds changes to (Double-Single-Double Single).

Whilst this change in order might seem inconsequential, the oxidized rearrangement (D-S-D-S known as a ‘conjugated diene’) has a particular property in that (unlike its unoxidised D-S-S-D cousin), it strongly absorbs ultraviolet light at a specific wavelength of 232 nanometers.

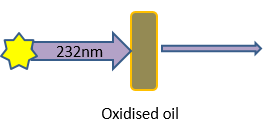
So shining a beam of UV light at 232nm at an oil and measuring how much of it is absorbed can be used as a measure of the oils oxidation status. This is done using a peice of scientific equipment called a spectrophotometer. A schematic as to how the analysis works is shown in Figure 1.

Figure 1: A schematic showing the basic principle behind the K232 analysis for oxidation.

Unit of Measurement: absorbance units(au).

Does it affect extra virgin olive oil status?: Yes. To be extra virgin, the oil must absorb at less than 2.55 absorbance units at 232nm. In my opinion 2.55 is (like most of the IOC limits), way too lax. Most 2 year old oils can make the grade pretty comfortably. But if that is what they want……

Is it a measure of quality?: Yes. K232 has been shown to be a good predictors of the freshness of extra virgin olive oil in Australian competitions (Australia is the only country that routinely measures the chemistry of competition entries).

Official method degree of difficulty: Easy, but for accuracy, the oil sample needs to be accurately diluted by a technician with a relatively expensive solvent so the cost is moderate. It can be measured using cheaper NIR (Near Infrared Spectroscopy) method. However, like all NIR analysis, the validity of the accuracy depends squarely on the quality of the calibration available to the laboratory.

Typical effects of high readings of UV 232

– The oil displays tiredness and in some cases rancidity.

– Shorter shelf life.

K232 level in extra virgin olive oil is increased by:

– Delays between harvest and processing, incidence of fungal disease, olive fly attack and frost damage increase K232.

– Age.

– Oxidative bottling practices.

– Poor storage conditions.

Post to Twitter Tweet This Post Post to Facebook Facebook

Comments
1 Comment »
Categories
Uncategorized
Comments rss Comments rss
Trackback Trackback

Polyphenols in Extra Virgin Olive Oil – Measurement and Effects

admin | October 12, 2015

This is the second of a short series aimed at explaining the whys, the how and the what (and the what-nots) of analyses that are commonly applied to extra virgin olive oil.

Analysis Name: Total polyphenols

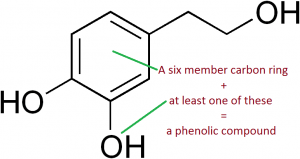
What does it measure?: The combined pool of compounds in olive oil that are in the phenolic chemical group (containing six carbon atoms attached to each other in a ring like formation with one or more oxygen+hydrogen groups attached to the ring). An example of a common olive oil polyphenol is shown in Figure 1.  In laymans terms, ‘total polyphenols’ are a measure of the combined total of the most important group of antioxidants in extra virgin olive oil.

Figure 1: Hydroxytyrosol – An example of a phenolic compound found in extra virgin olive oil.


Does the polyphenol level affect extra virgin olive oil status?: No. Many perfectly grown and made olive oils have low or medium polyphenol levels.

How it works: The polyphenols are extracted from the oil into a water/alcohol mix. A reagent is added which reacts with the polyphenols turning it blue/green. The depth of the blue/green colour is measured, and is directly proportional to the amount of polyphenols in the sample.

Is it a measure of quality?: Depends. Quality is a term that encompasses the general concept of ‘fitness for use’. So if you are ‘I want to live forever’ type of person then yes higher polyphenols which are of the antioxidant family could be perceived to be of higher quality in your eyes.  But conversely if you want to use extra virgin olive oil to make great tasting grilled potato slices on the BBQ for your hungry kids that don’t taste bitter, then a high polyphenol oil (by a consistently applied ‘fitness for use’ criterion), is of lower quality.

Analysis debuted: 1958. Initially developed for wine polyphenol analysis,  It was officially adopted in a modified (but in an incompetely described form) for olive oil by the International Olive Council in 2005.

Unit of Measurement: milligrams/kilogram of oil (1mg=1/1,000 of a gram).

Range in Extra Virgin Olive Oil: 80-2,000 mg/kg (measured as caffeic acid equivalents). Common range 200-400 mg/kg.

Accuracy of method: The first step of the analysis involves extracting the polyphenols out of the oil using a solvent. This step, depending on how carefully it is done, can cause variable end results in the order of +/- 10%. For this reason, it is necessary to repeat the test and take an average.

Use by olive oil producers: Unknown. Probably more so by New World olive producers.

Degree of difficulty: By automated lab standards the method is time and labour intensive, and therefore relatively expensive.

Practical effects of high readings of polyphenols

–  Typically more bitter and/or pungent (peppery).

–  Greater health benefits.

–  Assists in prolonging shelf life.

–  Potential for slightly higher smoke point.

Polyphenol level in extra virgin olive oil is affected by:

Cultivar – some varieties of olives tend to produce naturally higher polyphenol levels than others. For example, the average polyphenol levels in oils made from the cultivar ‘Coratina’ are significantly higher than those made from the cultivar ‘Arbequina’.

Olive maturity at harvest – The greener the olives used to make the oil, the higher the polyphenol levels.

Climate – Cool climates tend to favour higher polyphenol levels.

Tree water status – Excessive water availability reduces polyphenol levels.

Enzymes – The use of enzymes as a processing aid increases polyphenol levels

Water use during processing – Adding water to olive paste before extraction (e.g. 3 phase processing) reduces polyphenol levels.

Post harvest – Delays between harvest and processing reduce polyphenol levels.

Disease/Fruit quality – Incidence of fungal disease, olive fly attack and frost damage decreases polyphenol levels.

Age of the oil – Polyphenols levels decline as the oil ages.

Other comments:

The method only measures the size of the entire pool of the hundreds of polyphenol types that exist in extra virgin olive oil. Information about the amount of a specific polyphenol can only be achieved using highly sophisticated methods called high performance liquid chromatography or HPLC.

The relatively high cost of conducting the official method has led to an alternative rapid method to be developed. Called NIR or Near Infrared Spectroscopy, it is a method that can almost instantly estimate the polyphenol reading from a drop of oil, and it costs around 1/5 that of the official method. However it has its limitations, and its accuracy is laboratory dependent. Something for another blog post.

Post to Twitter Tweet This Post Post to Facebook Facebook

Comments
2 Comments »
Categories
Health, Production, Quality and Tasting, Use
Comments rss Comments rss
Trackback Trackback

Acidity in Extra Virgin Olive Oil

admin | August 12, 2015

This is the first of a short series explaining the common chemical analyses applied to extra virgin olive oil. I’ll start off with the most universal analysis of them all – “Free fatty Acidity” – or known to most of us as ‘Acidity’.

Name: Free Fatty Acidity or FFA

Better known as: ‘Free Acidity’ or simply ‘Acidity’

What does it measure?: The level of breakdown of the fats in extra virgin olive oil.

Analysis debuted: Circa 1890

Use by olive oil producers: Universal

Degree of difficulty: Easy. Can be done using basic lab equipment and little technical expertise. You can see me conducting an FFA analysis here

Official Iimit for extra virgin status: < 0.8%

Unofficial limit strived for by good EVOO producers: <0.2%

Direct effects of high readings of FFA:

  • Lower smoke point (the temperature at which the oil starts to smoke when heated)
  • Greasy mouth-feel/aftertaste
  • Shorter shelf life

Typical indirect effects of high FFA:

  • Reduced positive flavours and/or greater defective fermented like flavours.

Common causes of high FFA:

  • Delays between harvesting and processing.
  • Diseased/damaged olives particularly due to olive fly infestation and anthracnose (fungus).
  • Bruising of olives during harvesting followed by processing delays.
  • Olives harvested from the ground.
  • Frozen/frosted olives.

What is Free Fatty Acidity?

Every fat molecules including that in olive oil is comprises 3 smaller parts called fatty acids that are connected together. Figure 1 is the typical fat molecule found in olive oil – three monounsaturated fatty acids called oleic acid linked together.

Figure 1: Extra Virgin Olive Oil Nirvana. A perfectly formed and intact fat typical of olive oil.

However, having 100% perfectly intact fats like those shown in Figure 1 molecules is “fat Nirvana”. Sort of like that place that the “Watchtower” magazines portray – where humans live in perfect harmony with dopey lions and really small monkeys (both of which are likely to kill you at any given moment, but somehow reassuringly, for different reasons). But, getting back to the point, extra virgin olive oil is a natural product, and therefore is less than perfect. Individual fatty acids can be chopped off the fat molecule if the olives are riddled with fungussy olive pestilence, are being gouged upon by olive fly maggots, bruised and battered during harvesting, or (more typically, and less dramatically) if the olives are left to even slightly decay in the interim between olive harvest and processing.

Figure 2: Formation of free fatty acids. The Pacman represents a lipase enzyme, but if you like, you can think of it as a Pacman.


Nature has devised a few ways of busting up intact fat molecules to form free (aka single) fatty acids. Her chopping utensil of choice are enzymes called lipases. They are found in the olive fruit, but in good fresh undamaged olives the lipases are harmlessly locked up in the olive cell away from the fat molecules that they desperately want to destroy. But when the olive cells are damaged in any way, the enzymes are able to escape from their compartments, and in frenzied attacks dismember the intact fat molecules freeing up fatty acid molecules (Figure 2). The more diseased the olive, or the longer the time gap between olive harvesting and processing, the more enzymatic activity and the higher the free fatty acidity.

Common misinterpretations/misrepresentations of FFA in olive oils.

“FFA is a good indicator of olive oil quality” –  Sort of right.

Free fatty acidity is widely acknowledged as a good index of general olive oil quality. While this is generally true, I have tasted many examples of higher FFA extra virgin olive oils that taste just fine, and conversely I have tasted many low FFA oils that are woefully defective. Take for example what is possibly the worst tasting defect in olive oil called muddy sediment. It has a foul (for olive oil) taste of parmesan cheese, baby vomit, salami, band-aids, horse stable and fetid milk (and combinations of these). An olive oil can pick up these characters from short term exposure to the particulate olive sediment that remains after oil extraction and which later falls to the bottom of a tank. The aroma compounds that contribute to this defect are very potent. Therefore whilst leaving the oil on the sediment may result in only a small break down of the fat (resulting in a small increase in FFA), this small increase in FFA can be accompanied by a large reduction in flavour quality.

“Refined olive oils have high FFA” – Very wrong!

Paradoxically nothing is further from the truth. Refined olive oils (i.e.  those labelled as pure, light and ‘olive oil’ ) have essentially zero FFA. Yep, zero. The confusion probably arises from the fact that badly made olive oils, i.e. oils with very high FFA’s are those destined for refining in the first place. The major purpose of the refining process is to remove the free fatty acids. This is effectively acheived by adding caustic soda which converts the free fatty acids to soap which can then be physically removed from the oil.

“The FFA of an EVOO increases substantially during storage” – Wrong again.

The production of free fatty acids from intact fat molecules is process that mostly involves the action of enzymes found within the olive which act in the presence of water. Once an olive oil has been properly extracted from the olive and most of the water has been removed (<0.1% remaining), further degradation in bottle leading to higher FFA is very unlikely. Typically, a properly processed EVOO with a low FFA of 0.2% at the time of processing, may get up to between 0.22% and 0.25% after 12 months of storage.  Ok, that’s a 10-20% increase, but when you consider that your typical inexpensive supermarket purchased EVOO from the EU typically starts at 0.60-0.80% the 0.02-0.05 increase in FFA due to storage is inconsequential.

“You can’t taste acidity in olive oil” – Got that one right.

The free fatty acids are so weak that they don’t have the ability to bother our otherwise very busy acid taste receptors.

“If the FFA of an olive oil is X% measured as oleic acid , this mean that the olive oil contains X% oleic acid”. – NO it does not mean that.

The “measured as oleic acid” is simply a unit of measurement. For a few anally retentive lipid chemists, it may seem important, but in reality, whichever fatty acid equivalent (pick one, any one), it really has bugger all effect on the final result. So everyone can ignore the “measured as” bit without any loss of meaning. That’s of course unless you are an anally retentive lipid chemist. But to satisfy the inevitable “% bi (oleic acid) curious” readers, I might have a go at explaining it in a forthcoming post.

Post to Twitter Tweet This Post Post to Facebook Facebook

Comments
2 Comments »
Categories
Production, Quality and Tasting, Uncategorized, Use
Comments rss Comments rss
Trackback Trackback

How Much Trans Fat is produced when you heat Extra Virgin Olive Oil?

admin | February 9, 2015

Some Background

All edible fats primarily comprise of fat molecules which in turn are made up of fatty acids. The fatty acids are made up of chains of carbon atoms that are held together mostly by single chemical bonds. But every now and then a double bond appears on the chain. The majority of the fatty acids in olive oil (typically 75%+) contain only one double bond, whilst the fatty acids that dominate most other edible oils contain a higher number of double bonds.

The double bonds in fatty acids allow them to be ‘kinked’. Normally they kink in one particular direction (known as the cis form). Upon heating however, a small proportion of these fatty acids kink in the opposite direction (known as the trans form) as the latter form is the most chemically stable. Our bodies have evolved to be able to use the cis type of fat for normal bodily functions, but not the trans type, the consequence being that consumption of the trans form results in cardiovascular disease.

What’s Been Done

A number of scientific studies have looked at the amount of trans fat formation in edible oils during heating. However, most used either temperatures way above those needed to fry, or the oil was heated for lengths of time that you would only use if you accidentally left oil on the stove before heading out for a vacation. These studies were conducted to replicate the type and length of heating used in commercial deep frying operations.

What’s Been Found

I have included all the studies where the temperature was kept to a recommended frying temperature 180-200C and where there was no possibility of the food that was being fried (if that was the case) contained trans fats themselves. Unfortunately, in all the studies excepting one, the length of time that the oil was heated for far exceeded a typical domestic frying time. However, the data they provided do allow estimates of how much trans fat is formed when cooking for shorter periods of time that are more typical of domestic frying.

Not many of these studies used EVOO as it is an oil that is rarely if ever used for continuous deep fat frying in a commercial environment (comparing how fats perform when heated for long periods of time as occurs in commercial fat frying operations is the purpose of most studies, as the results have big $ implications). However, the same basic chemistry of isomerisation apply to all oils, so I have also summarised the results from these.

Table 1: Trans fat formation in edible fats after heating

Type of oil Time (mins) Frying Temp

oC

Estimated increase* in trans fats

after 20 mins of frying (mg/kg)

Comment Reference
Extra virgin olive 120 180 0 Oven Albi et al. 1997
Rapeseed 10 180 0 Frypan Hrncirik & Zeelenberg 2013
Sunflower 10 180 30 Increase not statistically significant Hrncirik & Zeelenberg 2013
Olive oil 45 230 6 In cooked dough Coponio 2003
Corn 15 180 5 Yang et al. 2012
Peanut 360 180 6 Kala et al. 2011
Sunflower 480 180 0 Steel pan Rani et al. 2010
Canola 240 180 5 Tsuzuki 2012
Corn 240 180 0 Tsuzuki 2012
Rice Bran 240 180 0 Tsuzuki 2012
Safflower 240 180 5 Tsuzuki 2012
Sesame 240 180 34 Tsuzuki 2012

*Estimated by linear interpolation at t=20 min. ** 1mg = 1/1,000th of a gram (which is about 1/50th the weight of a drop of water)

Results

The level of trans fats of most of the edible oils, including olive oil, did not increase by heating using typical temperatures needed for frying. In olive oil, the largest increase was 5 x 1,000th of a gram per kilogram of oil, and in EVOO no increase was observed.

EVOO is theoretically more resistant to trans fat formation, as being mostly monounsaturated it contains fewer double bonds than that of polyunsaturated fats such as sunflower or vegetable (soybean) oil. Also studies including those presented here have shown that natural antioxidants such as tocopherol and polyphenols which are abundant in EVOO inhibit the fat transing to the dark side.

But for some perspective – The average amount of trans fats in a 170 gm serving of french fries made by two major fast food chains (sampled from 20 countries) was found to be 4 grams (Stender et al. 2006). While this high level may be the result of prolonged high temperature heating, it is far more likely due to the high trans fat content (up to 25%) of the partially hydrogenated oils (1) that are commonly used in the fast food industry.

Based on the worst case result shown in Table 1, i.e. a 5 mg/kg increase in trans fat after heating, you would have to eat 310 servings of olive oil cooked French fries (53 kg or 140lbs worth) to get the same trans fat fix as a single serving cooked in an average fast food establishment (2).

Stender and colleagues in the New England Journal of Medicine stated that….

“Owing to the very high content of industrially produced trans fatty acids in certain fast foods, in many countries it is possible to consume 10 to 25 g of these trans fatty acids in one day and for habitual consumers of large amounts of this food to have an average daily intake far above 5 g”

Based on the studies above, heating 1kg of olive oil yields between 0 and 5mg of trans fat.

5 grams = 1,000 x 5 mg !

References:

Albi, T., Lanzo, A., Guinda, M.C., Perez-Camino, C. and Leon, M. (1997) Microwave and conventional heating effects on some physical and chemical parameters of edible fats. J. Agric. Food Chem. 45, 3000-3003.

Caponio, F., Pasqualone, A. and Gomes, T. (2003) Changes in the fatty acid composition of vegetable oils in model doughs submitted to conventional or microwave heating Int. J. of Food Sci. Tech. 38, 481–486

Hrncirik, K. and Zeelenberg, M. (2014) Stability of essential fatty acids and formation of nutritionally undesirable compounds in baking and shallow frying. J Am. Oil Chem. Soc. 91, 591–598 DOI 10.1007/s11746-013-2401-2

Rani, A.K.S., Reddy, S.Y. and Chetana, R. (2010) Quality changes in trans and trans free fats/oils and products during frying. Eur Food Res Technol. 230, 803–811. DOI 10.1007/s00217-010-1225-7123

Stender, S., Dyerberg, J. and Astrup, A. (2006) High levels of industrially produced trans fat in popular fast foods. New Eng. J. Med. 354, 1650-1652.

Kala, A.L., Joshi, V. and Gurudutt, K.N. (2012) Effect of heating oils and fats in containers of different materials on their trans fatty acid content. J. Sci. Food Agric. 92, 2227-2233.

Tsuzuki. W. (2012) Study of the formation of trans fatty acids in model oils (triacylglycerols) and edible oils during the heating process. JARQ 46, 215-220.

Yang, M., Yang, Y., Nie, S. Xie, M. and Chen, F. (2012) Analysis and formation of trans fatty acids in corn oil during the heating process. J. Am. Oil Chem. Soc. 89, 859–867. DOI 10.1007/s11746-011-1974-x

Footnotes:

(1) Hydrogenation is an industrial process mostly applied to polyunsaturated oils to make them semi-solid, and to increase their resistance to oxidation/rancidity. A by-product of partial hydrogenation is trans-fat production.

(2) given the reasonable assumptions of 1) oil retention of 15%, and 2) EVOO that had been heated for 20 minutes at 180C

Disclaimer: The information provided above is intended as general, and is not meant to be viewed as specific health advice.

Post to Twitter Tweet This Post Post to Facebook Facebook

Comments
1 Comment »
Categories
Uncategorized
Comments rss Comments rss
Trackback Trackback

What does filtering extra virgin olive oil do to it?

admin | January 12, 2015

At last! A paper reporting the effects of real olive mill based filtration on extra virgin olive oil composition. To date all research on the effects of filtration have been conducted using small lab based simulations.

Bakhouche et al. (2014) Monitoring the moisture reduction and status of bioactive compounds in extra-virgin olive oil over the industrial filtration process. Food Control. 40, 292-299. http://dx.doi.org/10.1016/j.foodcont.2013.12.012

The why?

Filtration is performed to produce perfectly clear oil that most consumers desire. But what are the consequences of filtering?

The how:

45 tonnes of two extra virgin olive oils were filtered through ‘cakes’ of Vitacel_L90 (30 kg, composed of 100% cellulose) and Filtracel_EFC-950 (60 kg, composed of 70% cellulose, 30% lignin) and the change in moisture and polyphenol content was monitored throughout the during the filtration process.

The outcomes:

– Filtering reduced the moisture content by between 20 and 36% depending on how ‘clogged’ the filter was at the time of sampling, and the initial moisture content of the oil.

– (illogically) filtration increased total polyphenols. However most polyphenol types were reduced following filtration particularly the small simple phenolics hydroxytyrosol and tyrosol.

Commentary:

The reduction in moisture content can be attributed to the water binding ability of polysaccharides (of which cellulose is one).

The observation that total polyphenols increased following filtration is ‘bizarre’. Filtration substrates do not contain polyphenols*, so logically, the filter material can either let polyphenols pass through resulting in no change, or adsorb them, which would result in a reduction in polyphenol content. The authors attribute the unexpected increase in polyphenols following filtration to limitations in how the dominant polyphenol class (the secoiridoids) are extracted from the oil prior to being quantified. That is, the illogical increase in polyphenols after filtration is an artifact of the laboratory measurement process.

The other polyphenol classes generally decreased due to filtration. As the filter material became more used, there was a trend for the difference between filtered and non-filtered samples to be reduced. This suggests that the filtration material was absorbing phenolics (because as the filter material has a finite number of binding sites, so as it becomes more used it is less effective in retaining phenolics – so the pass through).

So what can we take out of the study.

1)      Filtration reduces the moisture content of extra virgin olive oil. Practically this is a positive effect as lower moisture means decreased chemical breakdown (hydrolysis) of the fat molecules that make up extra virgin olive oil that lead to free fatty acids (acidity). Lower oil acidity is associated with greater oxidative stability aka shelf life, and higher smoke points.

2)      The effect of filtration on polyphenol content of extra virgin olive oil is still a ‘bit murky’, however there is some evidence that filtration does reduce polyphenols or at least some types of polyphenols.

* The increase in polyphenols was caused mainly by increases in secoiridoid compounds which are found in olive fruit. This rules out the possibility that the filter material inadvertently contained some form of phenolic contaminant which was extracted into the oil during filtration.

Post to Twitter Tweet This Post Post to Facebook Facebook

Comments
Comments Off on What does filtering extra virgin olive oil do to it?
Categories
Production, Quality and Tasting
Comments rss Comments rss
Trackback Trackback

Are Some Edible Oils Potentially More Fattening Than Others?

admin | January 6, 2015

I often get asked whether extra virgin olive oil is more fattening than other edible oils. Given the frequency that the question is posed, I’ll assume that there is some ‘information’ out there somewhere saying that it must be so. Or perhaps it is just a case of people thinking that if extra virgin olive oil is so healthy for you then it must have some downside. Can’t have your cake and eat it too right?

So I searched the peer-reviewed scientific literature to find out the energy (or calorific) values of different edible oils. Two papers provided some relevant data.

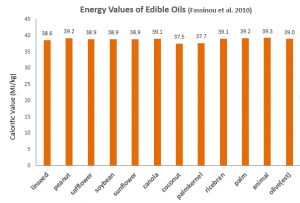
Fassinou et al. (2010) measured the energy values for a wide range of edible oils (Figure 1), but unfortunately olive oil was not one of them. However I’ve provided a logical estimate of the energy value of extra virgin olive oil based on the predictive model that they derived (1).

Figure showing the calories in different cooking oils

Figure 1: Energy values of various edible oils. Value for extra virgin olive oil is an estimate. See footnote 1.

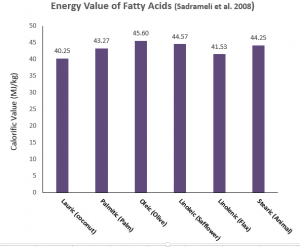
Sadrameli et al. (2008) determined the energy values of the free fatty acids themselves (actual edible oils comprise 3 fatty acids of various sorts joined together to a glycerol molecule, not as individual free fatty acids). However, these values can presumably be good proxies of the energy values of the edible oils that are rich in a particular fatty acid (oleic acid makes up on average ¾ of the fatty acids in olive oil for example) (Figure 2). However as all edible fats comprise a mixture of fatty acids combined in various combinations in groups of three, this data is at best an estimate of the energy values of real edible oils.

Figure 2: Energy values of different fatty acids. Examples of edible fats that have high proportions of that fatty acid are given in parenthesis.

So what’s the conclusion? There is no practical difference in the energy values of the different edible oils.

OK, these results do not consider that our bodies may absorb one type of fat differently from another. Some have suggested that we absorb short chain fatty acids such as those found in coconut oil differently. You can read more about the good, the bad and the ugly of this possibility elsewhere in this blog (search for coconut oil in the search box to the right), but based purely on the maximum potential of each fat to contribute to our daily energy intake, there is little evidence of any practical differences between edible oils when it comes to their energy quotient (2).

References

Fassinou, W.F.,